




Written by: Aaron Rovner, Founder, Saas Hero | Last updated: August 31, 2026
Key Takeaways
- Define a precise Ideal Customer Profile (ICP) using firmographics, technographics, and behavioral triggers. This focus can boost conversion rates up to 68% and cut wasted ad spend by 30–40% within 60 days.
- Combine content marketing and SEO to attract and educate your ICP. This pairing can deliver 3x more leads at 62% lower cost per lead with a three-year ROI around 702%.
- Run a multi-channel demand generation mix of paid search, paid social, and email to reach the full buying committee. Over 70% of the B2B journey now happens before prospects contact sales.
- Shift optimization from form fills to CRM-verified pipeline metrics such as CAC, LTV, and payback period. This shift ensures budget allocation drives real revenue outcomes rather than vanity metrics.
- Book a discovery call with SaaSHero to receive a free audit of your four pillars of B2B SaaS marketing strategy. Use the findings to execute a 90-day roadmap that turns these insights into measurable pipeline growth.
Pillar 1: Ideal Customer Profile (ICP) Mastery
Why a Precise ICP Sits at the Foundation
An ICP is a detailed description of the company that gets the most value from your product. It goes beyond firmographics to include technographics, behavioral triggers, pain points, and buying committee structure. A well-defined ICP shapes every downstream marketing decision. It guides which keywords to bid on, which content to create, which audiences to target on LinkedIn, and which conversion events to prioritize.
Broad targeting drives inflated CAC, and refining the ICP is the fastest way to reduce it. Most SaaS companies can cut CAC by 30–40% within 60 days by stopping campaigns that target unlikely converters. Targeting everyone with a broad ICP becomes the master mistake that makes every channel underperform. With that foundation in mind, here is a step-by-step process to build your ICP.
How to Execute: A Step-by-Step ICP Process
- Analyze your best 20 customers. Look for patterns in company size, industry, tech stack, trigger events, and champion title. Build the ICP from your own data first by looking at what your best customers share.
- Conduct win/loss interviews. Talk to five best customers and five churned customers to understand why they bought or did not buy. Interviewing best and churned customers clarifies the ICP and shapes targeting and messaging.
- Enrich with firmographic and technographic data. Tools like HubSpot, Salesforce, and 6sense can surface patterns that remain invisible in CRM records alone.
- Validate with sales. Ensure sales agrees on who the ICP is and can disqualify prospects who do not fit. This shared definition is the foundation of sales-marketing alignment, because both teams then pursue the same target accounts.
- Define your negative ICP. Defining who to avoid targeting, such as companies under $5M ARR or without dedicated sales leadership, matters as much as defining who to pursue.
ICP Pitfalls to Watch For
- Making the ICP too broad. “Mid-market B2B companies” is a demographic, not an ICP.
- Ignoring behavioral and psychographic signals. Behaviors like recent hiring or funding predict conversion better than company size alone.
- Letting the ICP sit static as the product evolves. Review and update the ICP quarterly as the real ICP evolves with business scale, market conditions, and customer patterns.
- Skipping the negative ICP. Pursuing disqualified prospects wastes sales capacity and inflates CAC.
ICP Metrics to Monitor
- ICP fit rate (percentage of leads matching ICP criteria)
- Lead-to-opportunity conversion rate by ICP segment
- Win rate by ICP segment
- CAC by ICP segment
Example: TripMaster, a SaaSHero client in transit software, rebuilt its paid search account around a precisely defined ICP focused on transit agencies and municipal operators with procurement-heavy buying cycles. See the Case Studies section for full performance results.
Pillar 2: Content Marketing & SEO
How Content and SEO Drive Revenue Together
Content marketing and SEO work together as a single growth engine. Content provides value that attracts your ICP, and SEO ensures that content is discoverable. In 2026, this reach extends beyond Google to AI search surfaces such as ChatGPT, Google AI Overviews, Gemini, and Perplexity. Your content must be both human-readable and machine-citable. A company absent from AI recommendation sets becomes invisible to buyers using those tools.
Organic search delivers about 5.3x ROI versus roughly 2x for paid search, and organic customer acquisition cost runs approximately 87.4% lower than paid search. The compounding nature of content creates its defining advantage. A blog post’s traffic in months 7–12 averages about 60% higher than in months 1–6.
How to Execute a Revenue-Focused Content Plan
- Develop a content strategy based on revenue location. Start from where revenue comes from, including segments, deal types, and buying triggers. Then find the keywords that sit closest to those revenue sources.
- Create a mix of content types. Use blog posts, case studies, whitepapers, comparison pages, and FAQ pages. Top-quartile SaaS companies publish 4.2 blog posts per week versus a median of 1.8.
- Implement technical SEO best practices. Use schema markup, llms.txt, and AI-readable content structure so AI assistants can cite your pages.
- Use programmatic SEO. Scale content creation for comparison, category, and long-tail keyword queries at volume.
- Optimize for AI search. Structure content for citation by AI assistants, not only for ranking in traditional search results.
Content and SEO Mistakes to Avoid
- Creating content for search volume rather than revenue potential. High-volume head terms often attract audiences that never buy.
- Ignoring AI search optimization. A material share of B2B research now runs through AI Overviews and ChatGPT, and content not structured for machine citation stays invisible in those surfaces.
- Publishing without a distribution plan. Every content asset needs a distribution strategy across email, social, and paid channels.
- Skipping content ROI measurement. Content marketing returns about $7.65 for every $1 spent when tracked against pipeline, not just traffic.
Content and SEO KPIs
- Organic traffic growth by revenue-relevant keyword cluster
- Keyword rankings for revenue-relevant terms
- Content-influenced pipeline (tracked in CRM)
- AI citation share, meaning how often AI assistants cite your content in relevant queries
Example: TestGorilla, a SaaSHero client in HR tech, used content marketing alongside paid acquisition to scale customer acquisition. The program achieved an 80-day payback period on paid acquisition with 5,000+ new customers added.
Pillar 3: Multi-Channel Demand Generation
Balancing Demand Creation and Demand Capture
Demand creation builds new intent through social, content, and brand awareness. It reaches people who have the problem but have not named it yet. Demand capture harvests existing intent through search, review sites, and retargeting. It reaches people actively looking for a solution. Quarterly pressure pushes budget toward demand capture because it is easier to measure, which causes growth to plateau. To avoid this trap, a multi-channel approach funds both jobs deliberately.
The average B2B purchase now involves 8 to 12 stakeholders, each doing independent research on their own schedule. A single-channel approach structurally fails to reach the full buying committee.
How to Execute a Multi-Channel Mix
- Build a deliberate channel mix. Use paid search on Google and Microsoft for demand capture. Use paid social on LinkedIn, Meta, and Reddit for demand creation. Use email for nurture. Concentrate on two or three channels done well rather than sprinkling across eight.
- Run a three-stage messaging cadence. SaaSHero’s Demand Creation Framework sequences messaging across awareness, consideration, and conversion. Awareness speaks to problems. Consideration introduces solutions and social proof. Conversion focuses on outcomes and ROI. Each stage has its own audience definition, optimization goal, and explicit exclusions.
- Allocate budget based on data. Test new channels with defined stages and measures. Multi-channel programs work when the system is coherent and fail when each channel assumes a different buyer journey.
- Integrate channels for a unified view. Judge demand creation channels on their own role. LinkedIn functions as a demand creation channel, and judging it on cold demo requests produces a false negative.
To allocate budget effectively, compare your current channel costs against these 2026 benchmarks. Focus on cost per qualified pipeline, not only cost per lead.
Channel Performance Benchmarks (2026)
| Channel | Median CPL | Notes |
|---|---|---|
| LinkedIn Ads | $142 | Most expensive per lead, and converts to pipeline at 2.3x the rate of content syndication |
| Google Ads (Search) | $125 | Branded search converts at 8.3% versus 2.1% for non-branded |
| Meta Ads | $98 | Effective for demand creation when used with staged messaging |
| Content Syndication | $42 | Lowest CPL, and only 3.8% SQL conversion rate |
Demand Generation Mistakes to Avoid
- Judging LinkedIn on demo requests from cold audiences. It functions as a demand creation channel rather than a demand capture channel.
- Spreading budget too thin across too many channels before any single channel is proven.
- Sticking to a channel mix out of habit rather than data. Teams often run acquisition before positioning is nailed down and add channels before choosing a primary go-to-market motion.
- Running conversion campaigns against cold audiences. Full-funnel programs pairing awareness with capture cut CPL by roughly 50% versus intent-only programs.
Demand Generation KPIs
- Cost per SQL by channel
- Pipeline created by channel
- CAC payback period by channel
- Branded search volume as a leading indicator of demand creation effectiveness
Example: Playvox, a SaaSHero client in CX software, achieved a 10x reduction in cost per lead alongside a 163% increase in lead volume through restructured multi-channel demand generation. The team optimized for pipeline quality rather than raw lead volume, which set up the next pillar on data-driven optimization.
Get a free B2B SaaS marketing strategy audit by booking a discovery call with SaaSHero.
Pillar 4: Data-Driven Optimization
Why Data Sits at the Core of Modern B2B SaaS Marketing
Data separates marketing that drives revenue from marketing that produces vanity metrics. The shift from form-fill optimization to CRM revenue data represents the most important structural change in B2B SaaS marketing over the past five years. An ad platform optimized toward a form fill finds the people most likely to fill in forms, such as students, competitors, and job seekers, while reporting a falling cost per conversion. A channel that looks expensive on a cost-per-click basis might be highly efficient on a cost-per-opportunity basis if it consistently attracts high-intent buyers.
A rising CAC payback period indicates broken unit economics regardless of traffic volume. The metric that matters is cost per sales-qualified opportunity, tracked against CRM-verified pipeline.
How to Execute Data-Driven Optimization
- Set up proper conversion tracking and attribution. W-shaped attribution, which weights first touch, lead creation, and opportunity creation, fits B2B SaaS funnels where the MQL-to-SQL transition is a meaningful milestone.
- Separate primary and secondary conversions. Primary conversions such as demo requests and SQLs train ad algorithms. Secondary conversions such as content downloads and webinar registrations are tracked but never used for account-wide optimization.
- Push lifecycle stage events back into ad platforms. When a lead becomes an SQL, when an opportunity is created, and when a deal closes, these CRM events should inform bidding so the algorithm learns from qualified outcomes.
- Implement CRM-connected dashboards. Use Looker Studio or HubSpot to connect ad spend to pipeline and revenue, not only to platform-reported conversions.
- Review core metrics regularly. Focus on CAC, LTV:CAC ratio, payback period, and pipeline coverage ratio.
Use these funnel conversion benchmarks to identify where your funnel leaks. Low visitor-to-lead rates point to landing page issues, while weak MQL-to-SQL rates often signal lead quality or sales alignment problems.
Funnel Conversion Benchmarks
| Stage | Median | Top Quartile |
|---|---|---|
| Visitor-to-Lead | 1.9% | 3.8% |
| Lead-to-MQL | 28% | 41% |
| MQL-to-SQL | 33% | 49% |
| SQL-to-Opportunity | 52% | 68% |
Data and Attribution Mistakes
- Optimizing to form fills rather than qualified pipeline. Ignoring offline and CRM-stage conversions systematically undervalues channels that drive high-intent prospects who convert through sales interactions.
- Relying on last-click attribution. Relying solely on platform-reported data leads to double-counting, as Google Ads, Meta, and LinkedIn each claim credit for the same conversion using their own lookback windows.
- Chasing perfect attribution instead of acting on CRM-verified pipeline signals. Perfect attribution remains impossible in B2B because buyers follow non-linear paths, including anonymous content consumption and private recommendations via Slack or conferences.
- Tracking too many metrics. After consolidating from 47 KPIs to five pipeline-focused metrics, one client’s board meeting took 12 minutes and resulted in a $200K budget reallocation to channels driving qualified demand.
Data-Driven KPIs
- CAC, with median B2B SaaS CAC at $702 and wide variation by vertical and ACV
- LTV:CAC ratio. An LTV:CAC ratio of 3:1 is generally considered healthy for SaaS, although the evidence does not specify a threshold for underinvestment.
- CAC payback period, where under 12 months looks strong
- Pipeline coverage ratio, with a 3–4x target as the healthy benchmark
Example: TripMaster’s results, detailed in the Case Studies section, show the impact of rebuilding paid search around CRM revenue data rather than form fills. Training the algorithm on qualified outcomes instead of raw conversion volume produced durable ARR growth.
Integration and Sequencing: How the Pillars Work Together
Having covered each pillar individually, it helps to see how they reinforce each other in practice. A strong ICP improves content targeting, which improves demand generation efficiency, which provides cleaner data for optimization. Fixing mistakes in order, starting with positioning and ICP, then motion, then channels, then measurement, keeps SaaS marketing plans from looking impressive yet performing poorly.
The following 90-day roadmap sequences implementation for maximum impact.
- Days 1–30: Foundation
- Define or refine ICP based on best customer analysis and win/loss interviews.
- Audit content and SEO, and identify gaps against revenue-relevant keyword clusters.
- Rebuild conversion tracking and attribution architecture, including primary and secondary conversions.
- Build campaign architecture, audience segmentation, and landing pages.
- Launch content and demand generation campaigns against the validated ICP.
- Begin A/B testing on landing page headlines, which represent the highest-leverage conversion variable.
- Monitor early data and adjust targeting based on CRM-verified lead quality.
- Analyze data across all pillars against pipeline outcomes rather than form-fill volume.
- Optimize campaigns based on CRM lifecycle stage events fed back into ad platforms.
- Plan next quarter’s strategy, channel mix, and budget allocation based on cost per SQL by channel.
Common Cross-Pillar Mistakes and Fixes
- Skipping a negative ICP. Explicitly identify who not to target, such as companies below your revenue floor, without dedicated sales leadership, or outside your serviceable segments.
- Creating content without a distribution plan. Give every content asset a distribution strategy across email, social, and paid channels before publishing.
- Spreading budget too thin across channels. Adding channels before one channel is truly working leads to channel sprawl where every motion is underfunded and performance takes too long to read.
- Ignoring CRM data for optimization. Connect ad platforms to CRM and optimize toward qualified pipeline instead of form fills. The algorithm rewards whatever it is trained on.
- Skipping landing page tests. Headline copy is the most impactful lever for landing page conversion, so test it before any other page element.
- Judging demand creation on demand capture metrics. Measure LinkedIn on engagement and audience build in the awareness stage rather than demo requests from cold audiences.
- Optimizing for CPL rather than pipeline quality. Optimizing only for CPL produces cheap leads that never become customers. Track cost per SQL and cost per opportunity instead.
Case Studies: The Four Pillars in Action
TripMaster — Transit Software
Pillars applied: ICP Mastery and Data-Driven Optimization. SaaSHero rebuilt the paid search account around CRM revenue data rather than form fills, targeting transit agencies and municipal operators with precision. Result: $504,758 in Net New ARR over one year, 650% ROAS, and a 20% conversion rate from paid search.

TripMaster adds $504,758 in Net New ARR in One Year TestGorilla — HR Tech
Pillars applied: Content Marketing & SEO and Multi-Channel Demand Generation. SaaSHero scaled paid acquisition without letting payback stretch past the point where growth stops paying for itself. Result: 80-day payback period on paid acquisition and 5,000+ new customers added.
Playvox — CX Software
Pillars applied: Multi-Channel Demand Generation and Data-Driven Optimization. SaaSHero restructured the paid demand generation program to optimize for pipeline quality rather than lead volume. Result: 10x reduction in cost per lead alongside a 163% increase in lead volume.
Frequently Asked Questions
How the Four Pillars Differ from the 4 Ps of Marketing
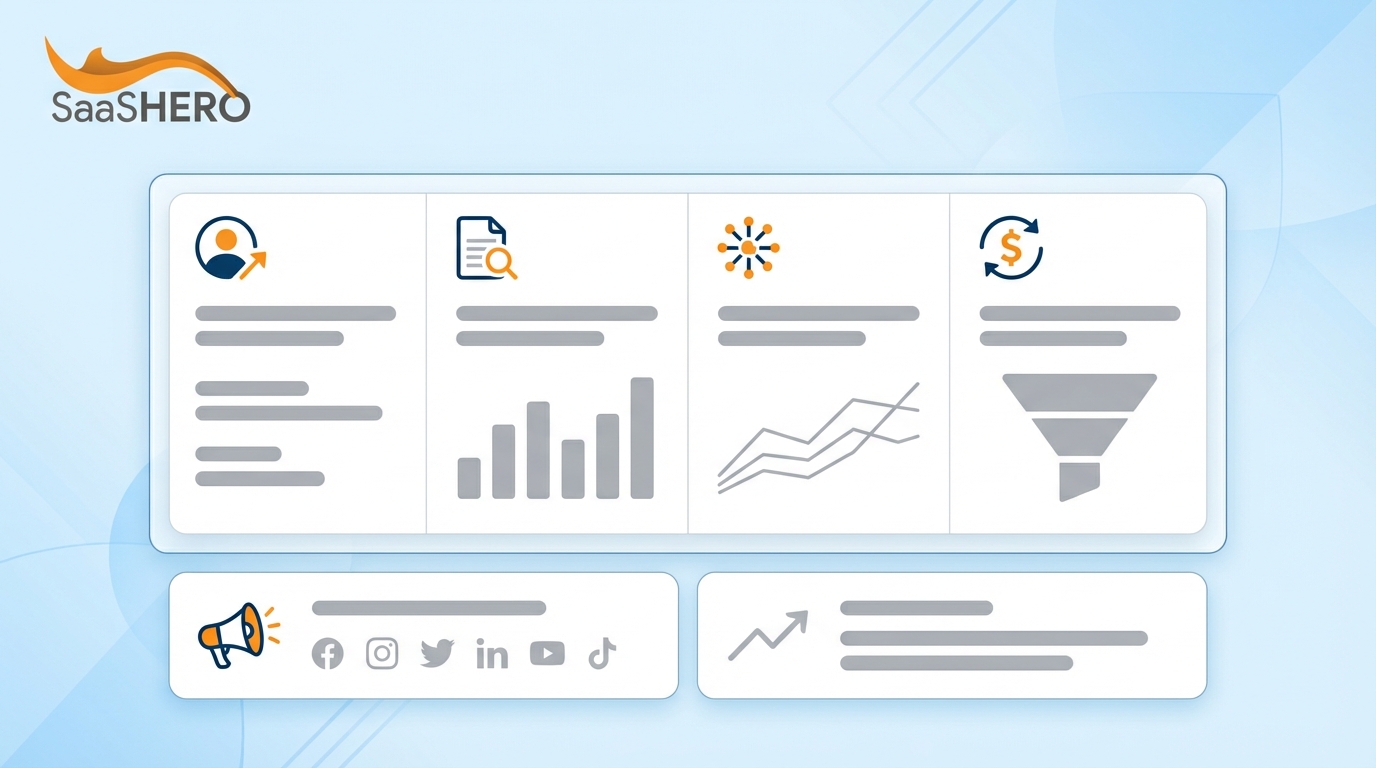
The 4 Ps, which are Product, Price, Place, and Promotion, form a general marketing framework developed in the 1960s for consumer goods. They address how a product is built, priced, distributed, and promoted. The four pillars of B2B SaaS marketing strategy, which are ICP Mastery, Content Marketing & SEO, Multi-Channel Demand Generation, and Data-Driven Optimization, apply specifically to modern B2B SaaS go-to-market execution. They assume the product and pricing are already established and focus entirely on how to build a revenue-generating marketing engine. The 4 Ps function as a product strategy framework, while the four pillars function as a demand generation execution framework.
How to Start Data-Driven Optimization Without a CRM
Start with a lightweight CRM such as HubSpot’s free tier. The essential requirement is a system of record for leads and pipeline. Without that system, there is no way to connect ad spend to revenue outcomes, and optimization defaults to form-fill counting. Once a CRM is in place, configure conversion tracking so that lifecycle stage events such as lead to MQL, MQL to SQL, and SQL to opportunity can be pushed back into ad platforms as optimization signals. The CRM provides the foundation, and everything else in data-driven optimization depends on it.
How Long It Takes to See Results from Content Marketing
B2B SaaS content programs typically break even around month 7, with three-year ROI around 702%. A blog post’s traffic in months 7–12 averages about 60% higher than in months 1–6. Content behaves as a compounding investment rather than a short-cycle tactic. This pattern means content programs need funding and measurement on a 12–18 month horizon to be evaluated fairly.
Read Next