




Written by: Aaron Rovner, Founder, Saas Hero | Last updated: August 31, 2026
Key Takeaways
- The classic 4 Ps of marketing must be reframed for B2B SaaS around recurring revenue, digital distribution, and CRM-level measurement to drive sustainable growth.
- Each P (Product, Price, Place, and Promotion) functions as a revenue lever tied directly to ARR, LTV, and qualified pipeline rather than isolated marketing tactics.
- Product-led growth shifts the entire marketing mix. The product itself becomes the primary acquisition channel, and pricing, distribution, and promotion decisions all revolve around activation and retention metrics.
- Measurement against CRM outcomes such as qualified pipeline, lifecycle stage, and closed revenue is essential. Focusing only on form fills or impressions creates disconnected tactics and flat pipeline.
- Ready to align your product messaging, pricing, and distribution channels into a single revenue system? Book a discovery call with SaaSHero to own your entire acquisition chain.
Why the 4 Ps Still Matter for B2B SaaS
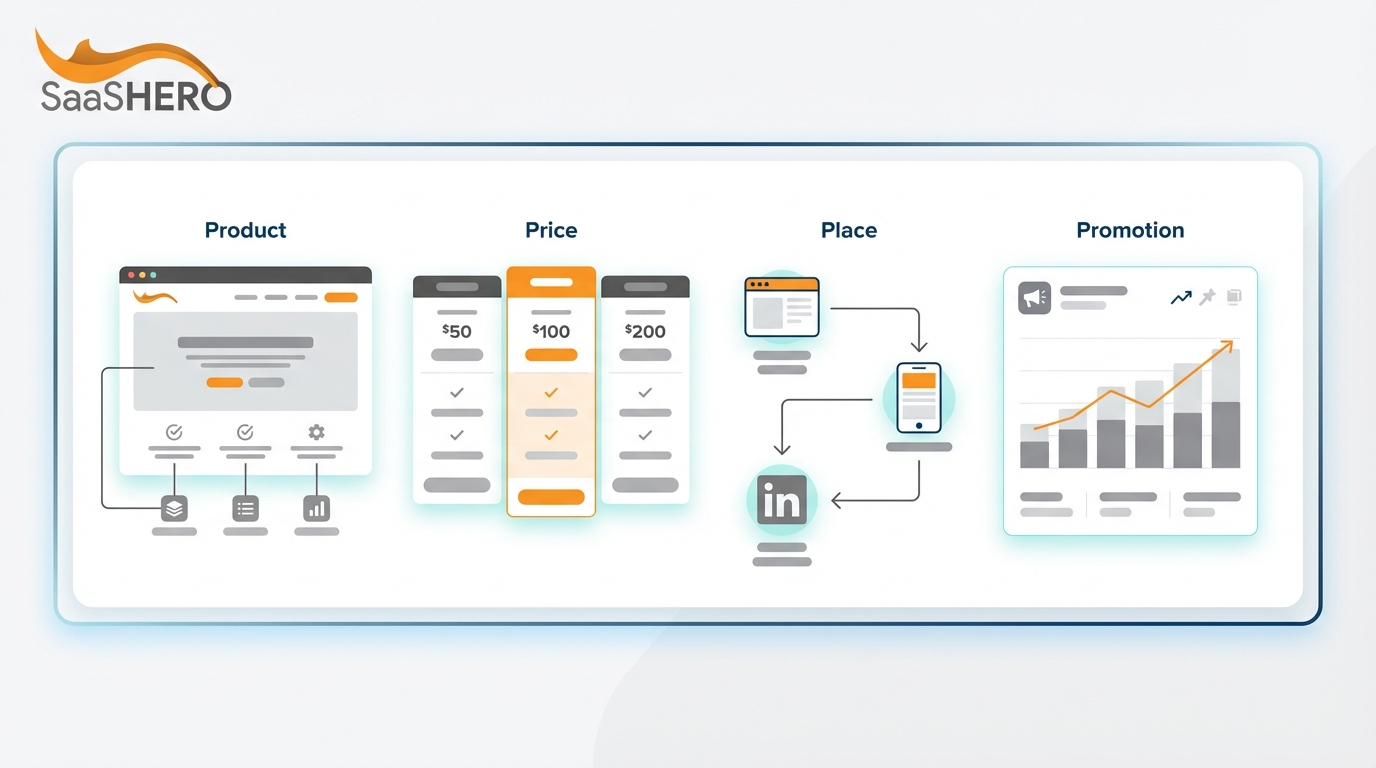
The 4 Ps remain a practical structure for auditing and improving a B2B SaaS marketing mix when you center them on recurring revenue and CRM-level measurement. Most explanations treat each P as a marketing activity, which produces disconnected tactics. A revenue-centric approach treats each P as a lever tied to ARR, LTV, and qualified pipeline.
Measurement binds the framework together. Without CRM-connected data, the 4 Ps operate as separate functions owned by different parties. An agency optimizes ads to form fills, a web team owns landing pages, and RevOps owns the CRM. Nobody owns the full outcome.
Booms and Bitner’s 1981 extension added People, Process, and Physical Evidence to create the 7 Ps for service industries. For B2B SaaS, People covers customer success and onboarding teams. Process covers onboarding and renewal flows. Physical Evidence covers case studies, G2 reviews, and security certifications. This article focuses on the core 4 Ps as a revenue system and notes where the extended framework applies. With that foundation in place, the first P to address is Product.
Product: From Features to Outcomes
In B2B SaaS, the product is the entire customer experience, including onboarding, integrations, support, and the measurable outcomes it delivers. Slack improves team communication velocity. HubSpot grows revenue. Snowflake reduces data infrastructure cost. An outcome-first product definition drives pipeline more effectively than a feature-first definition.
Product-led growth (PLG) reshapes the entire marketing mix, not just the pricing model. According to OpenView Partners’ 2025 Product Benchmarks, PLG companies grow 2 times faster than sales-led peers at similar stages and ARR levels. The product becomes the primary distribution and promotion channel. Product decisions therefore become marketing decisions.
Key product levers for B2B SaaS work together to drive activation and retention.
- Onboarding experience and time-to-value. Best-in-class time-to-value is under 5 minutes for simple PLG tools and under 48 hours for enterprise software access, while full organizational value realization for enterprise typically takes 30–90 days.
- Integration ecosystem across CRM, SSO, and API connections. Eighty-three percent of buyers surveyed were part of a buying committee before purchasing, and integration gaps are a common reason for shortlist changes. Ninety percent of B2B buyers say integration ability significantly influences shortlist decisions.
- Self-serve versus sales-led motion design. Most companies past $10M ARR run a hybrid motion that blends both approaches.
- Feature adoption breadth. Valiotti’s product analytics guidance notes that accounts using four or more core features often see 2–3 times the NRR of accounts using one or two core features, based on experiential observation.
- Activation rate. The industry average activation rate for B2B SaaS is 37.5%.
Once you have identified your key product levers, use this checklist to define your SaaS product value proposition.
- Identify the primary job-to-be-done.
- Quantify the impact in dollars saved, hours recovered, or revenue generated.
- Articulate the unique differentiator against alternatives.
- Map the activation event that predicts retention.
Price: SaaS Pricing Models and Value-Based Pricing
Price in B2B SaaS states the product’s economic worth through subscription tiers, usage-based metrics, freemium access, or hybrid models. It also acts as the highest-leverage growth variable. Most B2B SaaS founders spend very little time on pricing strategy each year, yet pricing is widely considered the highest-leverage growth variable, with a greater impact on ARR growth than acquisition, retention, or expansion.
McKinsey found that a 1% improvement in pricing yields approximately an 8.7% increase in operating profits, compared to about 3.3% for a 1% volume improvement and about 3.8% for a 1% reduction in variable costs. This finding highlights how sensitive profit is to pricing decisions.
The table below compares common SaaS pricing models across acquisition advantages and retention risks so you can see which approach fits your product and market.
| Pricing Model | Best For | Acquisition Advantage | Retention Risk |
|---|---|---|---|
| Per-seat | Collaboration, CRM, project management | Predictable and easy to explain | Seat-sharing and adoption friction |
| Usage-based | API, infrastructure, AI products | Low entry barrier and value alignment | Bill shock and revenue unpredictability |
| Tiered | Broad segment products | Natural upgrade path and segment capture | Feature gating frustration |
| Freemium | Network-effect products | Organic acquisition and virality | Two to five percent conversion rate and infrastructure cost |
A simple value-based pricing framework keeps pricing tied to customer outcomes.
- Determine willingness to pay through Van Westendorp surveys with 50–100 prospects for enterprise SaaS, while other stages often require 100–300 responses.
- Quantify the value delivered. If a product saves $500K per year, price at 10–30% of value captured.
- Segment pricing by company size, use case, or consumption level.
- Review pricing regularly. Companies that review pricing quarterly are more likely to be high-growth, although the exact growth multiple varies by study.
Underpricing appears far more common than overpricing in B2B SaaS. Most B2B SaaS companies can increase prices by 5–15% with minimal impact on conversion, while increases of 20–30% typically cause 5–25% additional churn and are not considered minimal impact. The customers lost at higher prices usually have the highest support costs and lowest retention.
Struggling to connect pricing decisions to pipeline outcomes? Book a discovery call with SaaSHero.
Place: Digital Distribution Channels for B2B SaaS
Place for SaaS means digital distribution, which covers where and how prospective buyers discover, evaluate, and purchase your product. This includes your website, SEO, marketplaces, partnerships, and product-led channels. In 2026, distribution extends well beyond your website.
Key distribution channels include the following options.
- Cloud marketplaces: AWS, Azure, and Google Cloud Marketplace. Transactions are projected to reach $85 billion by 2028 (Canalys) and $163 billion by 2030 (Omdia), with no specific projection of $100 billion for 2026–2027.
- Ecosystem marketplaces: Salesforce AppExchange, ServiceNow Store, and HubSpot Marketplace. Eighty-seven percent of channel partners report customers purchasing through hyperscaler marketplaces at least somewhat frequently.
- Review platforms: G2, Capterra, and TrustRadius. According to G2’s report, 92.4% of B2B buyers say reviews influence their purchase decisions.
- Product-led channels: In-app virality, free trials, and freemium entry points.
- Partner and reseller channels: Introw’s 2024 research shows partner-attributed deals close at a win rate 2.8 times higher than non-partner deals.
PLG and sales-led motions shape distribution in different ways.
- PLG distribution: The product itself acts as the channel. Users self-serve, experience value, and expand organically. This approach works best for ACVs under $10K.
- Sales-led distribution: Marketing generates demand and sales converts it. This approach works best for ACVs above $25K with buying committees.
- Hybrid: Most companies past $10M ARR run a hybrid model with product-led entry for smaller accounts and sales-assisted expansion for enterprise.
Use this channel selection checklist to focus your distribution strategy.
- Align channels with buyer journey stage such as awareness, evaluation, or purchase.
- Consider cost per acquisition by channel. Marketplace-sourced median CAC is $190 versus direct paid at $720.
- Leverage your existing customer base for referrals and expansion.
- Evaluate ecosystem fit. As noted earlier, integration ability significantly influences shortlist decisions for 90% of B2B buyers.
The most underutilized distribution channel for mid-market B2B SaaS is often the CRM that already exists. Companies that optimize against CRM data can see which channels actually produce qualified pipeline rather than just leads.
Promotion: Demand Generation for B2B SaaS
Promotion in B2B SaaS means demand generation, which uses content marketing, paid advertising, ABM, and sales enablement to educate buying committees and drive qualified pipeline. Most B2B SaaS promotion still optimizes toward form fills instead of revenue.
When ad platforms are trained on form submissions, they find the cheapest people to convert: students, job seekers, and competitors. The algorithm optimizes for whatever it is rewarded for, so it keeps finding more of the same low-quality leads. This pattern creates a self-fulfilling prophecy where cost per lead falls, lead volume rises, and pipeline stays flat.
Demand creation and demand capture play different roles in this system.
- Demand capture: Paid search on Google Ads or Microsoft Ads captures existing intent when someone types their problem into a search box.
- Demand creation: Paid social on LinkedIn, Meta, or Reddit creates awareness among people who have the problem but have not named it. Nobody opens LinkedIn specifically to buy software.
Promotion levers for B2B SaaS span several channels and tactics.
- Paid search for demand capture.
- Paid social for demand creation.
- Content marketing through SEO, blogs, whitepapers, and case studies.
- Webinars and virtual events.
- Account-based marketing for high-value targets.
- Sales enablement assets such as battle cards, ROI calculators, and pitch decks.
The median B2B SaaS sales cycle is approximately 84 days, with the mean typically ranging from 104 to 134 days depending on the source. This long cycle means last-click attribution is structurally wrong for most B2B SaaS companies. The channels that created demand appear weak because the final click was a branded search. Multi-touch attribution provides a more accurate view for long B2B sales cycles.
The most effective promotion strategy relies on a single team that owns the entire chain, including ad copy, landing pages, conversion tracking, and CRM integration. When different vendors split these responsibilities, accountability for results disappears. This integrated approach becomes even more critical as the 4 Ps evolve to address modern SaaS realities.
Modern Adaptations: PLG, Ecosystem, and the Shift to 7 Ps
The 4 Ps have evolved to address product-led growth, ecosystem distribution, and the service layer that surrounds software. In 2025, 58% of SaaS companies identified as product-led, up from 48% in 2020.
For B2B SaaS, the 7 Ps extension maps to specific functions.
- People: Customer success, onboarding specialists, and support teams. This area often delivers the highest ROI among the 7 Ps.
- Process: Onboarding flows, renewal processes, and expansion motions.
- Physical Evidence: Case studies, G2 reviews, security certifications such as SOC 2 and GDPR, and demo environments.
PLG reshapes how the 4 Ps work together.
- Product becomes the primary acquisition channel.
- Place shifts toward product surfaces and self-serve entry points.
- Promotion focuses on channels that drive activation rather than only awareness.
- Price becomes a product feature through freemium, free trial, or reverse trial models.
Indirect SaaS revenue through partner channels represents a significant and growing share of total SaaS revenue, although specific dollar figures vary by source. According to ICONIQ’s 2026 State of GTM data, partner channels grew roughly two times faster than direct SaaS sales in B2B software revenue over the past year, with channel and partnerships rising from 21% to 31% while direct sales fell from 73% to 57%. Ecosystem distribution therefore means Place extends far beyond your website.
Measurement: KPIs for Each P and How to Iterate
Each P must be measured against CRM-level outcomes such as qualified pipeline, lifecycle stage, and closed revenue rather than platform metrics like form fills or impressions. The table below maps each P to its primary KPIs, leading indicators, and red flags so you can quickly spot where your marketing mix leaks revenue.
The iteration loop keeps the 4 Ps aligned with revenue.
- Define primary conversion events such as SQL, opportunity, and closed revenue.
- Push lifecycle stage events back into ad platforms for optimization.
- Review performance against CRM data weekly instead of relying only on platform dashboards.
- Reallocate budget based on qualified pipeline rather than form volume.
The most common failure in B2B SaaS marketing comes from optimizing toward the wrong conversion event. When an ad platform is trained on form fills, it optimizes for the cheapest conversions, which are rarely the people who actually purchase. The correction is to change what you send back to the platform and use qualified opportunities and lifecycle stage events instead of raw form submissions.
FAQ: 4 Ps for B2B SaaS
Here are answers to common questions about applying the 4 Ps framework to B2B SaaS.
Are the 4 Ps still relevant for B2B SaaS?
The 4 Ps remain relevant when adapted to SaaS realities. The core framework of Product, Price, Place, and Promotion still offers a useful structure for auditing and improving a marketing mix. The key adaptation is measurement. Each P must be managed against CRM data such as qualified pipeline and revenue rather than platform metrics like form fills or clicks. A VP of Marketing who cannot connect each P to a pipeline outcome runs disconnected tactics instead of a revenue system.
What is the difference between the 4 Ps and 7 Ps for SaaS?
The 7 Ps add People, Process, and Physical Evidence to address service industries. For B2B SaaS, People covers customer success and onboarding teams. Process covers onboarding flows and renewal motions. Physical Evidence covers case studies, G2 reviews, and security certifications such as SOC 2 and GDPR. The 7 Ps matter for SaaS because churn often comes from service experience, including dissatisfaction with product and customer success, rather than only from missing features. The 4 Ps form the core revenue framework, and the 7 Ps add the service layer that shapes retention and expansion.
How do I apply the 4 Ps to a product-led growth company?
In PLG, the product becomes the primary distribution and promotion channel. Place shifts toward product surfaces and self-serve entry points instead of outbound-only sales motions. Promotion focuses on channels that drive product activation and in-product engagement rather than only demo requests. Price becomes a product feature through freemium, free trial, or reverse trial models that let users experience value before purchase. The key metric is activation rate, which measures the percentage of signups that reach the activation event predicting long-term retention. As mentioned earlier, most B2B SaaS companies past $10M ARR run a hybrid model.
What is the most important P for B2B SaaS?
Price usually delivers the highest leverage. As mentioned earlier, McKinsey found that a 1% improvement in pricing yields an 8.7% increase in operating profits. Pricing often has a greater impact on ARR growth than acquisition, retention, or expansion. Despite this, most B2B SaaS founders spend very little time on pricing strategy each year. Underpricing appears far more common than overpricing. Most B2B SaaS companies can increase prices by 5–15% with minimal impact on conversion, while increases of 20–30% typically cause 5–25% additional churn and are not considered minimal impact. The customers lost at higher prices usually have the highest support costs and lowest retention rates.
How do I measure the effectiveness of my marketing mix?
Measure each P against CRM-level outcomes and connect the metrics to see the full picture. For Product, track activation rate, time-to-value, and feature adoption breadth. Accounts using four or more core features often see 2–3 times the NRR of accounts using one or two, which directly affects Price metrics. For Price, track ARPU, LTV:CAC ratio, and CAC payback period. A healthy LTV:CAC is 3:1, and CAC payback under 12 months is strong. For Place, track CAC by channel and conversion rate by channel to identify which distribution channels produce qualified pipeline rather than only traffic. For Promotion, track MQLs, SQLs, pipeline created, and ROI instead of impressions or form fills. The key is connecting ad platform data to CRM data so every budget decision relies on pipeline evidence rather than platform dashboards.
Conclusion: The 4 Ps as a Revenue System
The 4 Ps function as a revenue system rather than a simple checklist. In B2B SaaS, each P must align with CRM data instead of platform metrics. When the Ps operate in silos, with an agency optimizing ads to form fills, a web team owning landing pages, and RevOps owning the CRM, the system breaks and nobody owns the full result.
The companies that win rely on one team that owns the entire chain from impression to CRM record. That team defines the product value proposition, sets the pricing model, manages the distribution channels, and runs the promotion strategy. All of these activities are measured against the same layer of qualified pipeline, lifecycle stage, and closed revenue.
A single diagnostic question reveals the health of the system: you either optimize campaigns around CRM data or around form submissions. If you cannot answer that with confidence, your 4 Ps are not yet working as a system.